Hmm... The CDC website data is getting concerning 2022.12
No opinion here, just check out the site.

For some reason on 12/15/2022 the mortality covid data only shows through 9/25/2022. Maybe because the trajectory of “updated booster” deaths was *not* looking good?
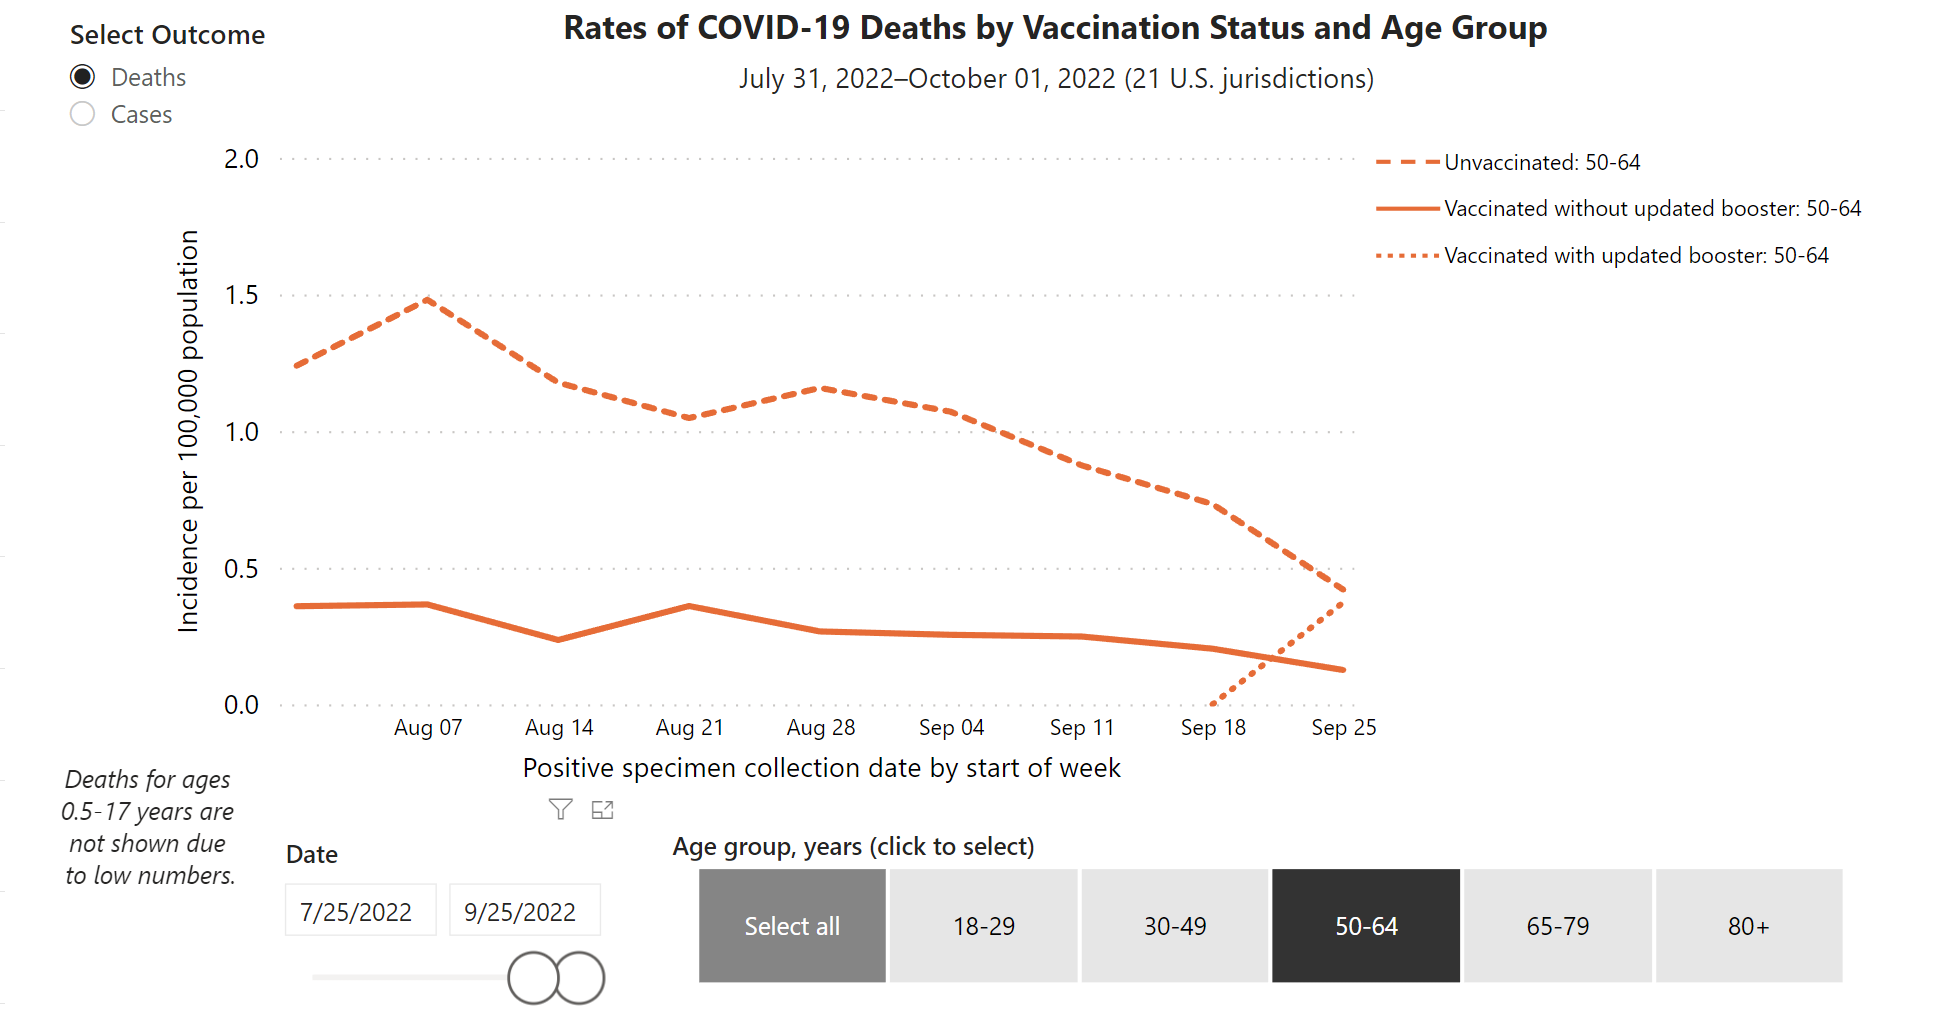
This is the chart generated by the website for 50-65yo based on the two most recent months. I’ll admit this is a bit cherry picked for clarity. Let’s just check the young folks:
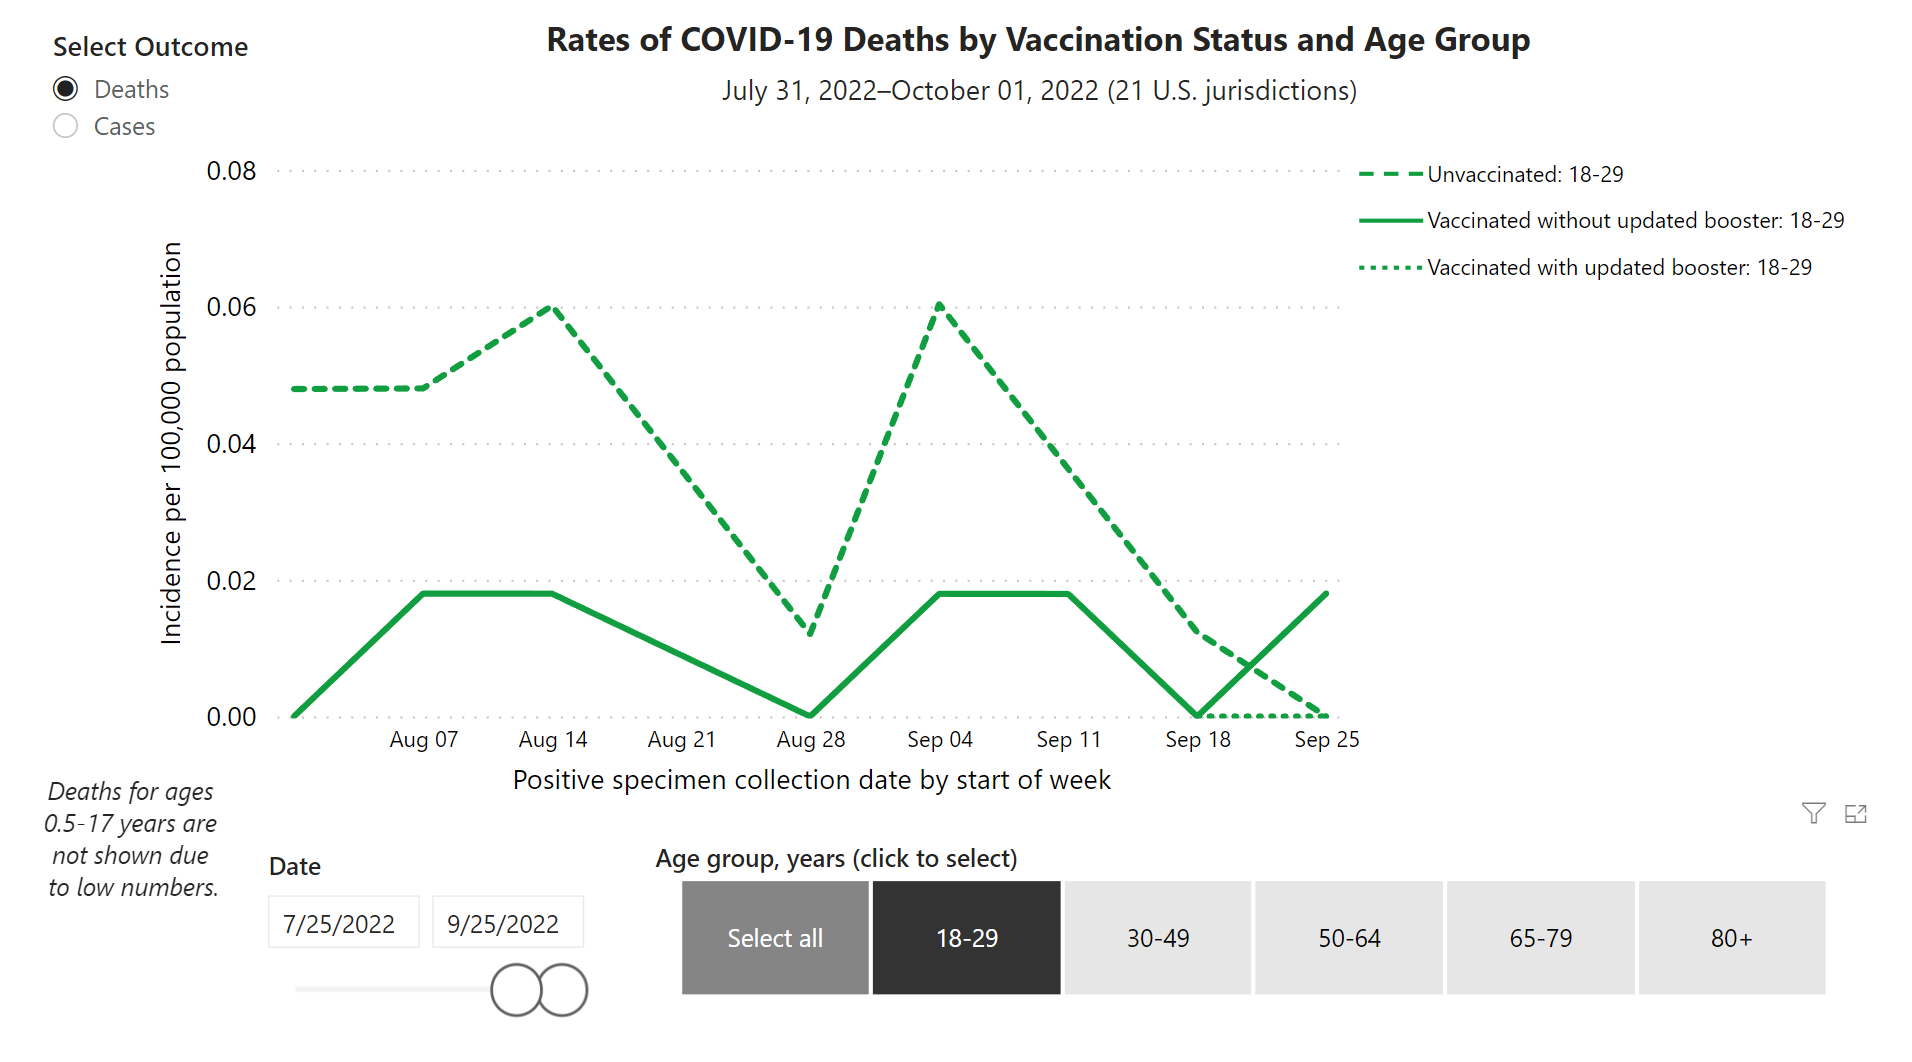
Eek, that’s not great. What else?
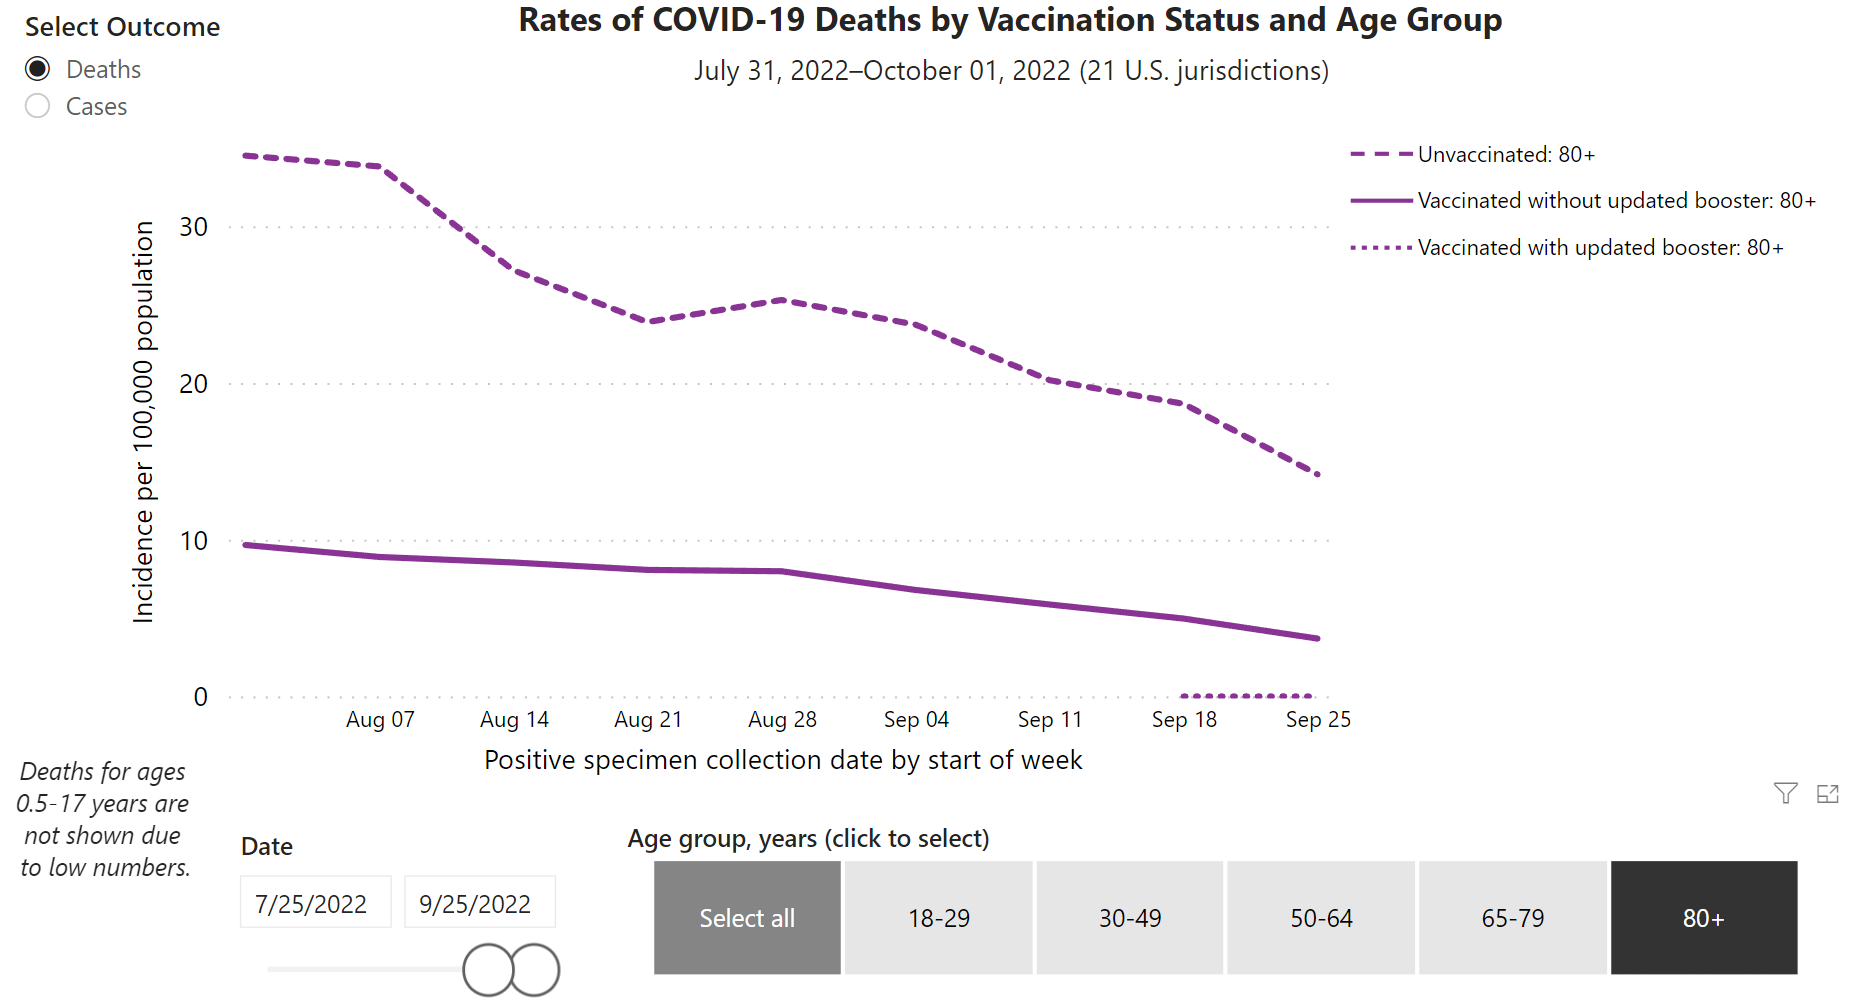
Hey that’s more like it. Credit where credit is due, this appears to do a much better job supporting the safety and effectiveness of the boosters, though with literally *one week* of “updated booster” data what is this really telling us?
Unfortunately, this exciting data is not worth much without telling us where it came from and defining these categories. This data came from “21 US Jurisdictions”. Wow, ok, which are those? Ok, it’s states and they represent a pretty nice range politically and geographically. Sure it would be nice to have more than 41% participation, but this ain’t bad.
How are the vaccination stats determined? Ok, unvaccinated is anyone “not verified to have had the vaccine.” Hmm, not crazy about that. Essentially anyone that does not fall into the other categories goes here. Vaccinated is anyone that has any kind of vaccine other than the bivalent booster. Updated booster is the bivalent booster. Teh kicker (aka usual trick) is for vaccinated the stats don’t start until 14 ore more days after the last dose. That is leaving out a LOT of data and a lot of deaths. Why not also publish deaths from COVID within the 2 weeks just to get all the data out there? At least they aren’t classifying them as unvaccinated, but they are undercounting deaths for sure. If I have time I may be able to dig through data and see if I can figure that number out. I doubt it.
A couple other oddities:
rates are based on the date of a positive covid test, not the date of death. Why? Does it make a difference?
unvaxed population is calculated by subtracting the number of vaccinated from 2019 census data, I guess how else would you do it?
Unfortunately I don’t have much of a conclusion here other than to say that the charts and data are not looking super good overall and I am interested to see more bivalent booster info as we move forward.